EdTechspiration

Helping teachers prepare students for tomorrow, today.

By

Tuesday’s Tech Tips 1/29/13 – Assessment and Technology

Capturing student learning – assessment and feedback – how do we quickly and efficiently measure understanding? These are very important when looking at technology as a tool to integrate with instruction. This week’s Tuesday’s Tech Tips is primarily focused on resources that will help you assess student understanding using technology without getting bogged down. To start off, I think it is important to get a good overview of what effective technology integration is about. This first video from Edutopia is well worth your time.


An Introduction to Technology Education

Integrating technology with face to face teacher time generally produces better academic outcomes than employing either technique alone.

http://www.edutopia.org/technology-integration-introduction-video


Inline image 2


The Road Ahead…
Kim Babin at CCI shared this video with me. It is an awesome example of where all this should be going. The kids used iPads, MacBooks, even an old Dell, to create a digital documentary out of a classroom literacy project. It is well worth your time. Kudos to Kim!

Socrative.com

Socrative is an awesome way to quickly create free on-line quizzes which students can take using a cell phone, tablet (iPad or Kindle), or a laptop. There is even a method of letting several students take turns with the same device if needed. There is a good introductory video about using Socrative on their website. The video below demos how to use socrative as a quick exit ticket strategy. Exit tickets are quick little assessments that students take at the end of class or a lecture to give you feedback about what they’ve learned. You can monitor the scores in real time and download the results in a spreadsheet.

Inline image 3

Socrative Web Site – http://www.socrative.com

http://vimeo.com/socrative/intro (This link may be filtered depending on your campus.)

Socrative Exit Ticket and Space Race – http://www.youtube.com/watch?v=0wNnVUKVIAc

Inline image 1


Designing Assessment Using the Power of Google Forms

Google Forms are essentially a survey tool wherein teachers can draft questions, whose answers can be collated and analyzed. Question types are text, paragraph text, multiple choice, checkboxes, choose from a list, scale and grid.

http://www.fractuslearning.com/2013/01/21/designing-assessment-google-forms/
A Favorite Formative Assessment: The Exit Slip
“When we think about all the different ways we check for understanding in the classroom, a go-to strategy for many teachers has always been the exit slip or exit ticket. For this strategy, students write at the conclusion of learning, sometimes on a half-sheet of paper with sentence starters provided. It’s then collected by the teacher. Why a favorite? Being that they come at the end of a lesson, unit, or segment of study, exit slips give teachers a snapshot of the overall student learning.”
Inline image 4
iOS App – Sock Puppets – another example of using the exit ticket strategy. Function v Relation in Sock Puppets

Using Media for Assessment
I really like Apple technology for students creating media based products to show what they know. Start with the Performance Indicators from the IFD in CSCOPE. If you start with the PI’s, it’s easier to integrate technology. The folks at ESC 12 have created a great resource for taking the verbs from the performance indicators and linking them to technology resources your students can use. High Tech CSCOPE Verbs I wrote a guided explanation of how to use this resource earlier this year. Click here for the instructions: Connecting EdTech to Curriculum
Here is a student example of using a cell phone to capture a video explanation of some Geometry concepts. I used this clip at last year’s math conference. (Yeah, I put her up to it. My family always gets the “privilege” of helping me with these things. If you see Cassie or either of my girls, they definitely deserve a pat on the back or a hug for putting up with all my “great ideas” over the years.)
Don’t forget about Marzano
Robert J. Marzano’s 9 instructional strategies work really well with both CSCOPE and technology integration. In this video, Dr. Marzano talks about integrating technology into teaching and the need for keeping up with change. You can find a good review of the Marzano 9 on Leander ISD’s website. It also has links to other resources that will help you. Here is a visual diagram as well. Start with any one strategy and begin by simply substituting a technology tool. For Identifying Similarities and Differences, the students can use spread sheets, charts, or drawing tools to substitute for Venn Diagrams. To take it to the next level, have your students create INFOGRAPHICS using sites like Infogram or  Visual.ly. Instead of simply summarizing, have students cut and paste text into Wordle to see which words stick out. Ask them what patterns they see and why.
From Small Beginnings….
Remember to start small. You are more likely to be successful with small instances of integrating technology into your class. Be consistent. Make sure that anything you do is to support student learning and aligned with our curriculum objectives. Give yourself and your permission to make mistakes. Don’t give up. We all feel awkward or uncertain at times. So do our students. We don’t have to be completely in control of the learning process 100% of the time. Some of the best learning comes from making mistakes and discovering together what works. Focus on what you can do instead of what stands in your way. Use what you have and be hungry for what you would like.
Inline image 5

By

Accidental Project Based Learning

I’ve had the opportunity to learn from many “artful accidents” through out my career. You go through the motions of lesson planning, gathering resources, setting your students up for success, but things do not always go as planned. Sometimes it is a disaster. Other times the results are amazing.

If you have any sort of knack for working with technology, it never takes long before your colleagues start bringing you little projects or problems to figure out. I have always tried to include my students in solving these problems if there is enough time in class. It provides an important opportunity to model life long learning and problem solving skills. It lets them see you when you don’t necessarily have all the answers. Every now and then a student will come up with a great solution or a new way of looking at the problem.

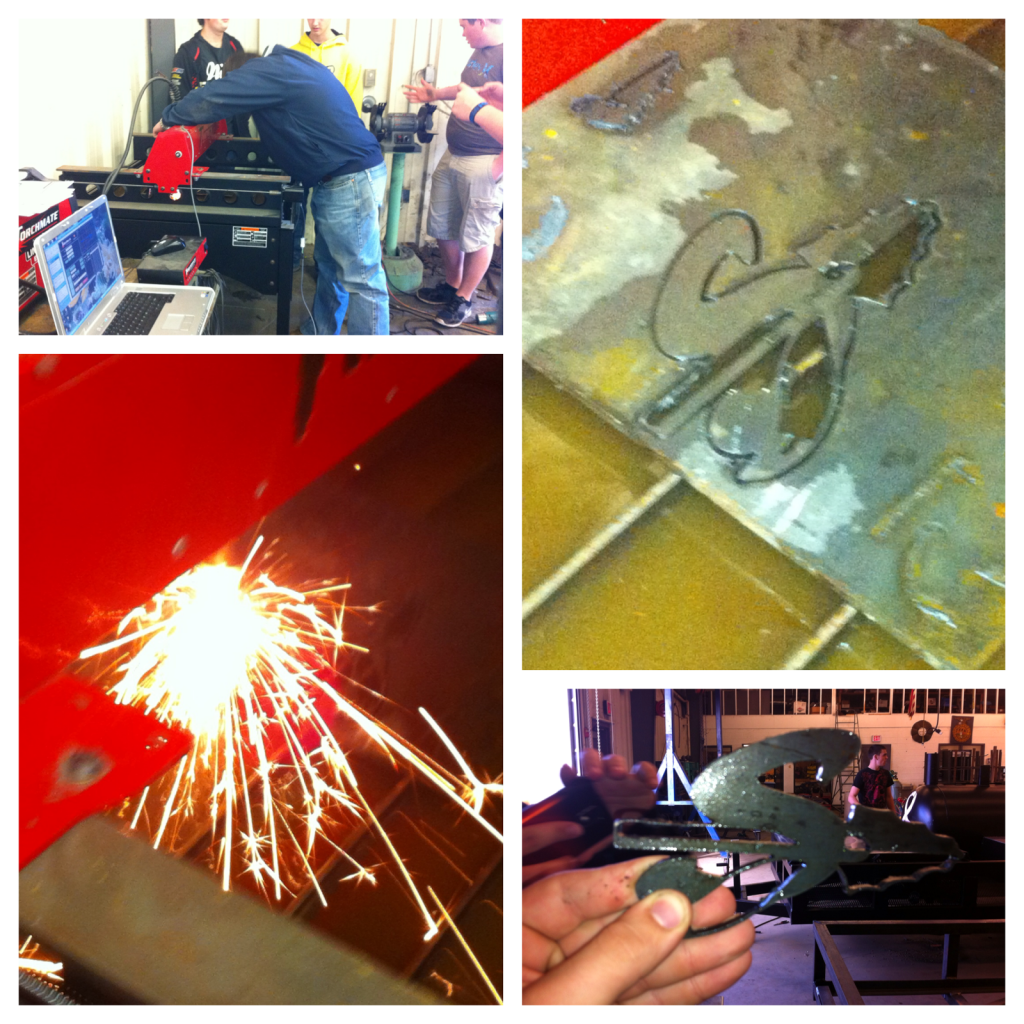
Case in point, yesterday I received a call from our Ag department. “Hey, can you help us figure out how to work this CAD program with our computer guided plasma cutter?” This was an intriguing problem with some amazing elements, technology, steel, fire and electricity… my answer, “I’ll be right there!” This was a great example of project based learning (PBL). Each person brought a different set of skills and perspectives which all came together in the successful creation of our district logo cut out of 1/4″ steel.

plasma cutter project

Ag students and the tech department work together to set up a computer based plasma cutter that imports images from a CAD program.

Everyone Engaged

In this example, PBL uses the different ideas of each individual to successfully complete the project. All the participants were engaged, several students took video footage and pictures of our progress with their phones. Everyone had a stake in the outcome. The students were equal participants with their teachers (the Ag teacher and myself). Everyone took some sense of ownership of the process and the outcome. Every student wanted to touch and examine the completed logo.

Learning from Failure

It took about ten different attempts to get the process right. With each failure, the group learned critical details which eventually led to success. Is the metal flat enough? Are we going too fast for the thickness? Is the amperage of the plasma cutter high enough? Should we fasten the ground wire to the metal or the chassis of the platform? How high should the cutting head be from the metal surface? None of these “failures” led to students giving up or developing low self-esteem. Instead, it increased their level of participation. They made valid observations and gave suggestions. Some worked and some didn’t.

At the end of the project, two class periods of students learned how to use the computer guided plasma cutter. Students from the first class period even came back during their lunch to work on the project. It is doubtful that anyone would have learned nearly as much had we taught this as a traditional lesson, with the steps outlined, and the details all laid out. That’s the beauty of PBL and why it has a place in the classroom… whether we facilitate these types of experiences for our students or they happen by accident.

By

Tuesday’s Tech Tips: 1/22/13

Happy Tuesday. I hope everyone who had the day off enjoyed the 3 day weekend.
Generation Gap?
There have been a lot of articles written about how different generations use technology. I disagree with many writers who value one generation’s use of technology over another’s. Boomers, Gen X’ers, and Millennials tend to use technology in unique ways. My 86 year old grandmother uses email daily to keep up with family and friends. My mother in-law uses email and Facebook. (So I had better not post anything rude or I’ll get into trouble!) My little brother thinks that Apple is most amazing company ever. I suspect if they asked him to put on a toga and sell flowers at the airport, he would happily comply. I discovered my daughter’s reliance on technology when her phone broke for an hour last fall. It wasn’t pretty. I still have nightmares.
The one thing that is constant is that each generation uses these tools to connect with others. This is where we as educators can leverage technology to help our students. Some of us (over 40) have to focus a little more on the buttons and clicks. Others of us have never known a time when there was not an Internet. Rather than characterize these differences as a Generation Gap, perhaps we should focus on how we can use these tools to help our kids do what they do naturally… make new connections. Connections with new ideas. Connections with new, authentic resources. Connections with one another.
I’ll wrap up with a video, shared by Jackie McBroom, that pokes fun at this issue. The video is in German, but you’ll get the gist.
SISD iOS Academy
We still have space in the iPad trainings. This is a wonderful way to get a $10 app for free just by learning how to use it. These classes are open to any SISD employee who has an iPad and wants to attend. Space is limited to 10 per session. The classes cover Pages (like MS Word), Keynote (like PowerPoint), and Numbers (like Excel) for the iPad. RSVP by emailing me.

Learning From My Students
This short article from Jennie Magiera’s EdTech Blog shares some great insights about teaching with technology.
“Teachers often feel like they have to follow the age-old “I do, We do, You do” for every lesson. This just isn’t so. As with teaching math and science, I love to pose a problem and let the students loose on it. I’m consistently amazed by the solutions with which they return. Even when they make mistakes – or go down the completely wrong path, we have learned as a classroom to discuss those mistakes and learn from each other.”
Kathy Schrock’s Guide to using the iPad in the Classroom
There are a ton of resources here many of which are extremely useful.

Edudemic has a great collection of Infographics. We live in a world of quick consumption, bite-size morsels of information, and visualizations of just about everything. If you use Anchor Charts from your CSCOPE curriculum, infographics are simply a way to do this digitally. This collection has some really great examples.

Learn How to Use Green Screen Effects in iMovie with this quick tutorial
Quick Article on How Technology is Changing Education for Students with Disabilities

By

Tuesday’s Tech Tips 1/16/12

Welcome back everyone! Hope you all had a great break. To ring off the new year, here are some fun and interesting tech resources that you may not have explored. This first one is from a great EdTech blog by Erin Klein. If you haven’t followed Erin, she is definitely worth your time. Kleinspiration http://www.kleinspiration.com Twitter: @KleinErin

MindMaple – sharing information through beautiful, colorful diagrams http://www.kleinspiration.com/2013/01/let-mindmaple-help-you-share.html 19 Handy


let-mindmaple-help-you-share.html.jpg

Google Tricks That You Weren’t Aware Of http://thenextweb.com/lifehacks/2012/12/09/19-handy-google-tricks-that-you-werent-aware-of/

Video INFOGRAPHIC – definitely raises the bar as to what can be done with these tools http://www.frequency.com/video/nuclear-test-in/185878 alt url: http://www.youtube.com/watch?feature=player_embedded&v=9U8CZAKSsNA#!

Tech lesson to help students use INFOGRAPHICS

This is a lesson that arranges the students into small groups at centers to work on different aspects of various INFOGRAPHICS. It is a great tool to study a particular subject or introduce a project where they make their own INFOGRAPHICS>

http://www.techchef4u.com/?tag=tools-to-make-infographics

…and on a final note, the Mayans were obviously wrong. 12/21/12 came and went with more of a whimper than a bang. Those of us who remember the hysteria of Y2K were let down because collective public craziness was no where near levels prior to then. (Younger teachers, just ask someone with grey hair to explain it.) The saddest part of it all is that the National Geographic, Discovery, SyFy and History channels no longer have programming to fill the void left by the defunct Mayan predictions.

0.jpg

By

Tuesday’s Tech Tips 12/11/12

Here are Tuesday’s Tech Tips for this week. I hope you can find something useful or at least interesting among these resources.
Infographics are useful for taking data that is too large for the brain to understand and communicating it with a picture. The imporance of using tools like infographics to help students begin to ask deeper questions about data and the relationships it communicates is a critical skill for their future. Since analyzing big data is a relatively new phenomenon, our TEKS have not kept up with this trend. Using Infographics in your classroom a step in the right direction.
60+ Great Educational Infographics for your Clasroom

Google Apps Tips for Educators

Free Technology for Teachers: How to Create PDFs in Google Drive in Three Steps
Free Technology for Teachers: 5,000 Stock Images for Google Drive Users
Google Presentation for Collaborative Learning
Vizaroo
Vizaroo – Collect Student Feedback in Diagrams
Cyberbullying
15 Strategies Educators Can Use to Stop Cyberbullying

By

Tuesday’s Tech Tips 12/4/12

Today’s tips will have something for most grades and aren’t just restricted to the Macs. Many of the Web 2.0 tools can be used on PCs as well.

This first tip is an article with supporting forms for having your students create a Video Vocabulary Lesson in iMovie. The author did this with her 2nd grade class, but you could extend the basic premise to most grades.

Vocabulary Videos w/ iMovie
This next tip is a pictorial matrix that helps you find Web 2.0 tools to use with your students based on the type of activity you want for them to do. It’s pretty cool and simple to use.
Mapping Media to Curriculum: What Do You Want to Create Today?
Google+ Hangouts
Best for grades 8 – 12:
32 Tips for Using Google + Hangouts in the Classroom

This one would be a good guide for anyone wanting to increase technology use in the classroom, covering curriculum, instruction, and assessment. Plus, it is short and sweet.
12 Characteristics of an iPad Ready Classroom

By

Tuesday’s Tech Tips 11/27/12

Here are some technology resources that you may find interesting. There is something here for Elementary and Secondary.

Flipped Classroom
16 Flipped Classrooms from Around the World
Teaching w/ the iPad
10 Popular Tools being Used on iPads in the Classroom
(These are really pretty good.)
TCEA’s new iBook,  The iPad in Elementary: ELA
Costs $2.99 but it looks interesting.
INFOGRAPHICS
INFOGRAPHICS as Creative Assessment by Kathy Schrock
Tools and Resources for Creating INFOGRAPHICS
What the heck is an INFOGRAPHIC?
Sample INFOGRAPHIC – Beware of the Internet Illnesses!!!

By

Tech Tuesday’s Resources for SISD Teachers

Fellow SISD Teachers,

Here are a couple of resources you may be interested in using.

similarsites.com
 SimilarSites.com
Feeling constrained by our bottle rocket web filter? Try SimilarSites.com – http://t.co/rDka30Ez You may find unblocked alternatives. Please remember that you can also submit sites to the IT Department (a.k.a. James & Chris) to review.
The 100 Best Web 2.0 Tools (Edudemic)
Featured in Edudemic, think of this massive list as a Where’s Waldo but for awesome resources. Each resource is written in big bold letters, followed by the description offered by the person who submitted the resource.
A Look at Google’s Massive Library of Free Lesson Plans (Edudemic)
Many of these fit well with CSCOPE’s scope and sequence and give you resources in addition to that CSCOPE’s many exemplar lessons.
http://edudemic.com/2012/11/a-look-at-googles-massive-library-of-free-lesson-plans/

2 of the resources (above) are from Edudemic, which is an amazing on-line magazine. http://edudemic.com

By

Use Sock Puppets for iOS as a Fun and Easy Exit Ticket Strategy

There are many fun and interesting iOS apps that students can use to creatively show their teacher if they understand some fundamental concepts from that day’s lesson. Sock Puppets is one such app. Though it is designed with younger students in mind, students of all ages can have fun with this app.

Get Sock Puppets

Exit Tickets

An exit ticket is an ideal way to end class as it provides the teacher a means to challenge the student with a question requiring some application of what was learned in that day’s lesson. The prompt or question should require only a brief time to respond to, certainly no more than five minutes, but perhaps only 1-2 minutes. An exit ticket is not intended to be a simple, quick summary and not a major task. The responses should not be part of formal assessment, but it can provide valuable feedback to the teacher.

The video below quickly demonstrates how students studying functional relationships in Algebra can use the Sock Puppets app as an exit ticket strategy to show that they know the difference between a function and a relation.


By

Connecting EdTech to Curriculum: Working with Performance Indicators

For technology integration to successfully support learning, it must be built upon a solid curricular foundation. Sometimes it is difficult to create projects which support curriculum and feel authentic.

So how do we design technology rich lessons which actually allow students to demonstrate mastery of curriculum objectives? One way of doing this is to use performance indicators. A performance indicator is a behavioral statement which describes what a student can do if they master a particular goal or learning objective.

For example, a typical Algebra I objective might read, “The student understands that a function represents a dependence of one quantity on another and can be described in a variety of ways.” An objective like this will actually be supported by a number of performance indicators describing skills or tasks that students should be able to do if they have truly mastered the objective. One of the performance indicators for this objective would read, “Interpret and make decisions, predictions, and critical judgments from functional relationships.

Where to I find technology resources that relate to this performance indicator? Fortunately, the staff at the Region 12 Education Service Center in Texas have created a web site that takes the mystery out of finding appropriate Web 2.0 resources to match specific performance indicators. Though this site is created to support CSCOPE, a widely adopted curriculum in Texas, it can be used for any set of content standards with performance indicators that your district happens to use.

verbs

Verbs from Performance Indicators

http://hightechcscopeverbs.wikispaces.com

To use this resource, simply find the verb in your performance indicator and click on that  same verb in the list. You will be redirected to a page containing a series of Web 2.0 resources that relate to that verb. For example, “Interpret and make decisions, predictions, and critical judgments from functional relationships,” contains the verb interpret. From the list of verbs, I click on the word, interpret.


verbs

Choose the verb used in your performance indicator

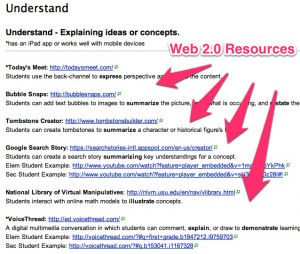
I am then redirected to a page of resources from which I can choose, or better yet, my students can choose, to demonstrate their ability to “Interpret and make decisions, predictions, and critical judgments from functional relationships.” The site actually groups the verbs into categories. Interpret is related to understanding, so when you click on that verb, it actually directs you to the resources listed for the verb, understand.

Web 2.0 Resources

Web 2.0 resources that students can use to demonstrate that they can “interpret” something.

You still have to establish criteria by which you will assess student performance, but this resource will at least take much of the ambiguity out of deciding where to start.

Skip to toolbar